BloodHound Enterprise: securing Active Directory using graphs
Prior to my employment at SpecterOps, I hadn’t worked in the information security industry- as a result, many security related terms and concepts that were tossed around casually (not just within SpecterOps, but also by the open source community using BloodHound) befuddled me, as did trying to apperceive how simply protecting a known valuable asset in an Active Directory (AD) environment could be complex enough to warrant an entire science behind it. Below, I attempt to delineate our problem space and how BloodHound Enterprise addresses it, by using the simplest analogies I’ve learned over 2+ years from Andy (https://twitter.com/_wald0), Rohan (https://twitter.com/CptJesus), John (https://www.linkedin.com/in/john-hopper-b20637b/), and Justin (https://twitter.com/JustinKohler10).
Let’s pretend, for a moment, that we’re in the middle of a zombie apocalypse and Manhattan (New York) remains the last infection-free zone in the United States. In AD terms, this would translate to Manhattan being our Tier Zero (T0) asset, into which zombies must not be able to enter under any circumstances. From this, we now have our problem statement:
What actions can we take to secure Manhattan from a zombie that is currently in another city?
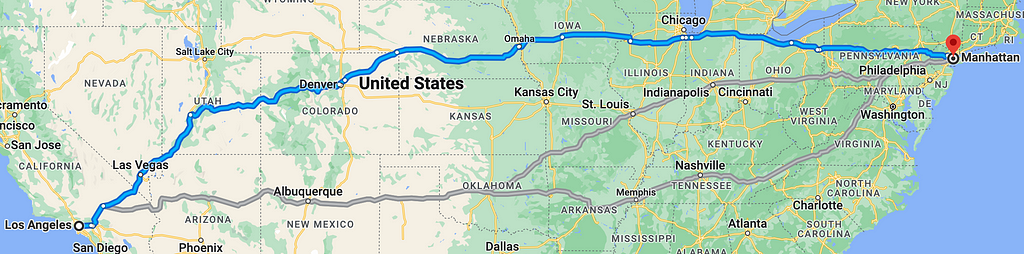
For now, let’s keep our scenario simple and say that the zombie is in Los Angeles (California) and only travels by paved, mapped roads. Initial mapping shows three viable routes to Manhattan:
These routes are what infosec experts like SpecterOps call Attack Paths (i.e., the path that a malicious party could potentially use in order to gain access to T0 [Manhattan] once access to a lesser non-T0 asset [Los Angeles] has been established). This is the basic premise behind BloodHound CE: to find such attack paths within an AD environment. Corporations are starting to place an increased emphasis on red team assessments, which also serve a similar purpose; however, there exists a significant limitation on these practices.
Let’s go back to the main route on our map, and pretend that there is a major road closure around Chicago (Illinois). Here is the updated route:
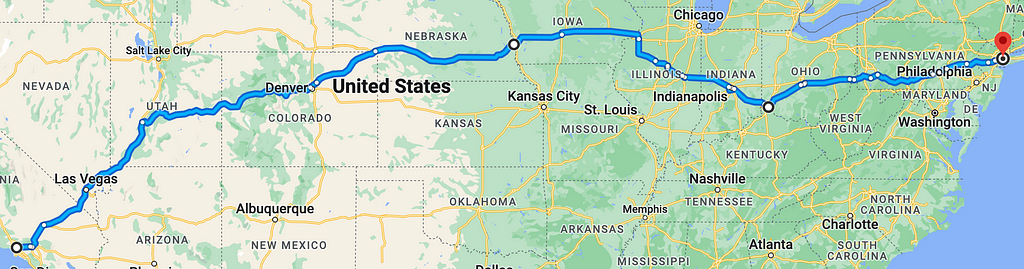
This route splits off before Chicago and traverses Indianapolis (Indiana); Columbus (Ohio), Cincinnati (Ohio), and Philadelphia (Pennsylvania) instead. As we continue to close off cities along the route, we will realize that this starts to form a pattern: removal of any major city leads to an alternate route through another. Drilling into finer granularity, this concept can be extended to smaller towns, and then into state and county highways, and then into side streets, and then into alleys–and this is just for one selected route! Beyond this, there exist many more routes at the top level (some going from the north above Lake Michigan, some going south through Arizona and Texas, etc.). The sheer number of attack paths leading to Manhattan is astounding!
And therein lies the problem with red team assessments (and BloodHound CE): although they reveal the presence of specific vulnerabilities in an environment, they cannot provide insight on how to cut off the “alternate routes” discussed above. These assessments and tools are wonderful for providing general security guidelines and remediating individual attack paths, but alternate attack paths will continue to exist in the environment and therefore form a seemingly never-ending loop of assessments and remediations.
What this problem demands in a solution is a set of actions that are truly precise and measurable:
- Precise in what action(s) AD administrators can take to secure their T0 domain
- Measurable in how much of an impact each action makes on their security posture
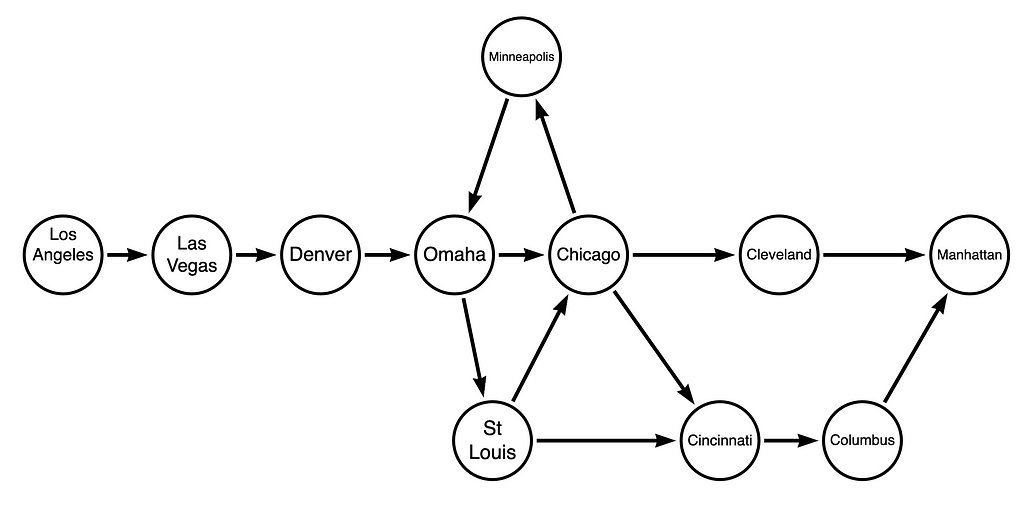
The solution to this is achieved by BloodHound Enterprise (BHE) and can be explained in terms of graph theory. Let’s view our Los Angeles zombie’s route as a directed graph, along with some alternative routes and their surrounding interconnections:
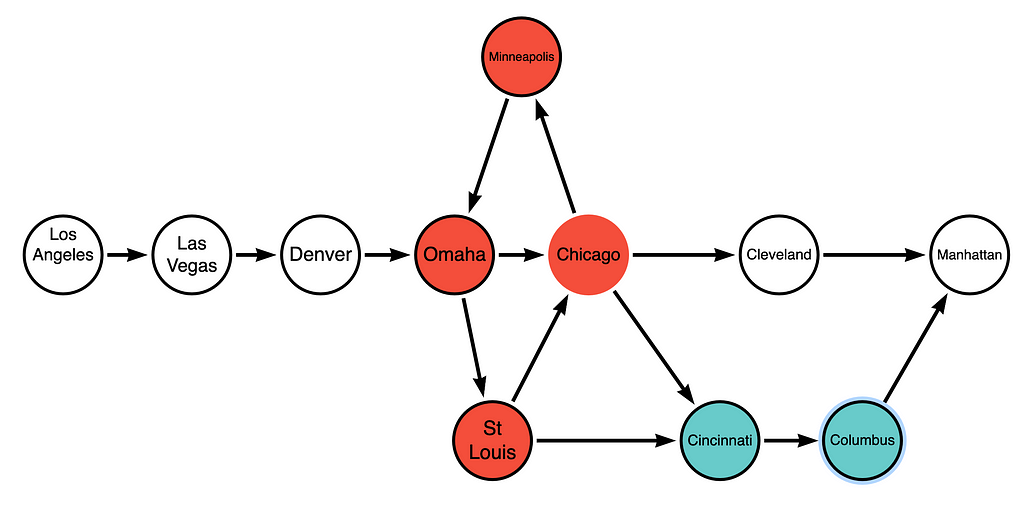
Some of these nodes can be collapsed into node-groups, which we shall call cliques from here on out. A clique is therefore a collection of interconnected nodes with definite edges into and out of it. The cliques are highlighted in red and blue below:
The graph with cliques then becomes:
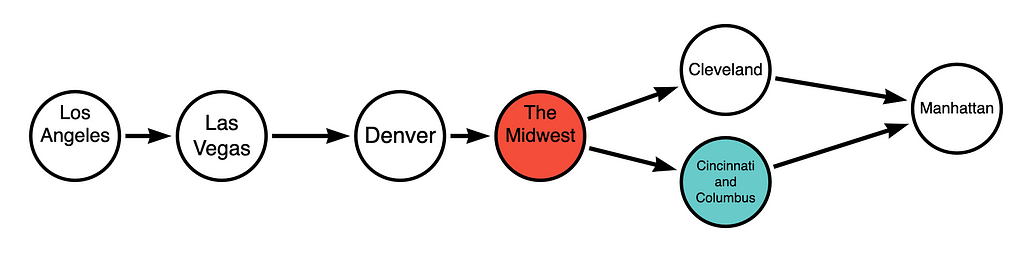
Further cliques may be produced from here. For instance, Los Angeles, California; and Las Vegas, Nevada would form the western clique, and so on to produce a tree that is highly comprehensible.
BloodHound Enterprise uses a patented, bespoke algorithm to:
- Read an AD environment as a cyclic graph
- Build cliques to simplify the graph
- Convert the resulting graph into a directed acyclic graph (also known as a tree)
- Use parameters from both the AD and the graph to assign weights to each edge, represented as a percentage of effect on security posture
The remediation measures spit out by BHE are therefore precise (in what exact edges to remove) as well as measurable (in the weights of edges removed).
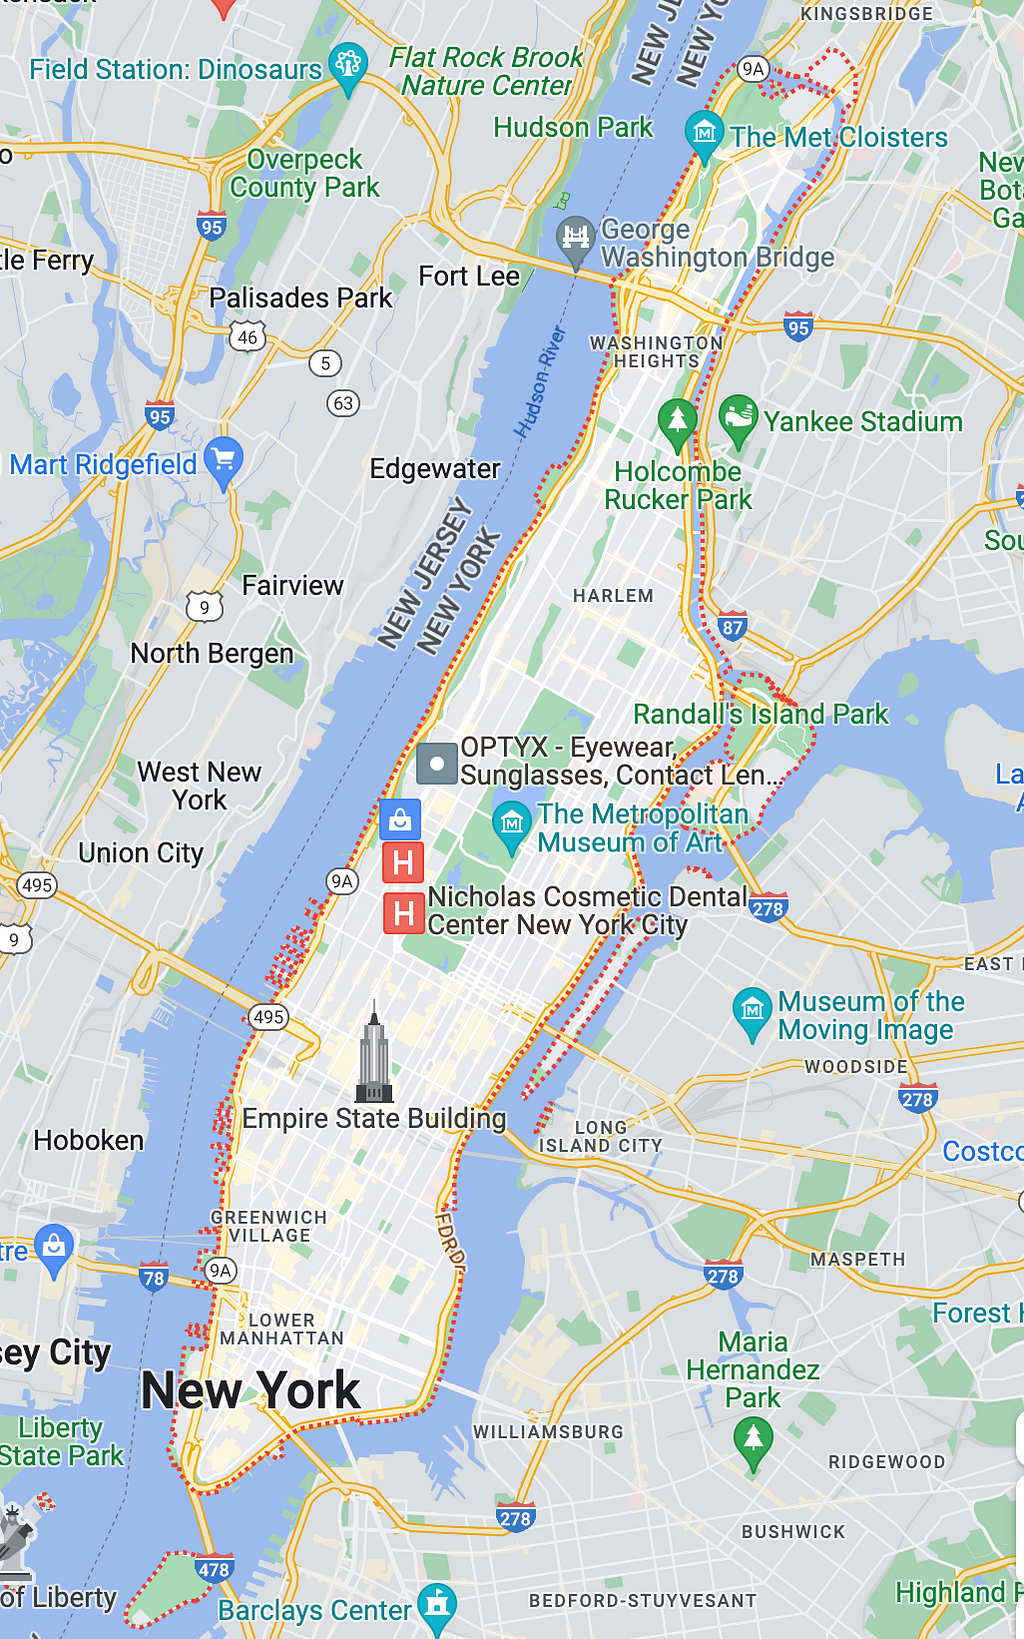
Let’s study our T0 location a little closer. Manhattan is an island connected to land by 21 bridges and 15 tunnels; so, irrespective of the state of the rest of the country, the security of Manhattan boils down to the accessibility of just these 36 bridges and tunnels. For an easier visualization, let’s disregard the tunnels in our scenario and just focus on the bridges.
If Manhattan were an AD environment, running it through BHE (sans the tunnels) would yield a weighted tree as shown below (note: the percentages have been assigned at random for convenience and do not represent the actual traffic volumes for each bridge):
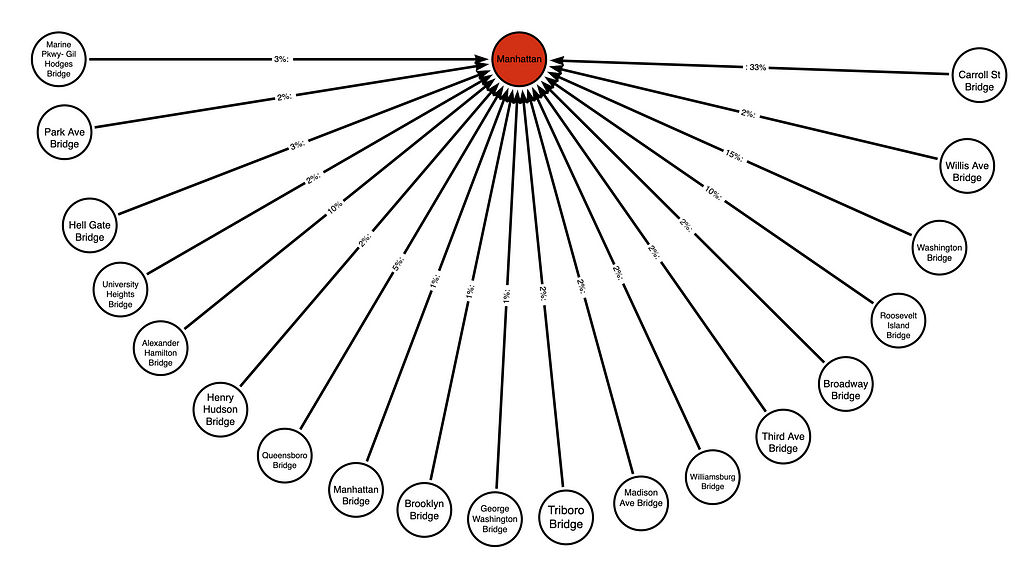
With weights assigned to each of the edges, improving the security of an AD is a matter of selecting the highest number and removing that edge from the environment; and that, in a nutshell, is the purpose and output of BloodHound Enterprise: a finite series of simple, precise, and measurable steps to secure your most valuable assets.
Bloodhound Enterprise: securing Active Directory using graph theory was originally published in Posts By SpecterOps Team Members on Medium, where people are continuing the conversation by highlighting and responding to this story.